What you need to know about the NOAA global warming faux pause paper

Last week, a paper out of NOAA concluded that contrary to the popular myth, there’s been no pause in global warming. The study made headlines across the world, including widely-read Guardian stories by John Abraham and Karl Mathiesen. In fact, there may have been information overload associated with the paper, but the key points are relatively straightforward and important.
1. Rapid Global Warming Continues
Arguments about short-term temperature changes only deal with the Earth’s surface temperatures, which account for just 1–2% of the overall warming of the planet. More than 90% of that heat goes into the oceans, and as my colleagues and I noted in a paper published 3 years ago, if anything that warming is accelerating, building up heat at a rate faster than 4 atomic bomb detonations per second.
If you carefully cherry pick start and end dates, you can find a period around 1998–2012 during which the warming of surface temperatures slowed a bit due to temporary natural cooling factors (like more La Niñas), just like it sped up a bit during the 1990s due to temporary natural warming factors (like more El Niños). But these are just wiggles on top of the long-term human-caused global warming trend. As Michael Mann put it,
2. The Surface Warming Slowdown is Probably Over
This is a tough pill to swallow for those who have misused the short-term slowdown in global surface warming to argue against climate policies, but it’s likely over. 2014 was the hottest year on record, and 2015 looks likely to break the record again.
These slowdown-based anti-policy arguments have been made by everyone fromRepublican presidential candidates to political think tanks to science-denying blogs. It’s a simple argument – if we pretend the surface warming slowdown can continue indefinitely, then global warming is less of a concern and we don’t need policies to stop it.
Since we’ve always known the slowdown was temporary, these were never credible arguments, but they nevertheless helped to delay efforts to curb global warming. After the publication of this NOAA paper, and possibly two consecutive record hot years, it seems unlikely that these arguments will be considered credible any longer.
3. The Most Common Denial Response: Conspiracy Theories
Social science research has shown that conspiracy theorists are more likely to reject scientists’ conclusions about climate change. It’s a logical connection – given that 97% of climate scientists and their research agree on human-caused global warming, the easiest way to deny that reality is to accuse all those scientists of being part of a vast conspiracy. Otherwise it’s difficult to justify rejecting the conclusions of 97% of experts.
Thus it’s not surprising that those in denial are accusing the NOAA scientists of conspiring to fudge the data to make the slowdown disappear. For example,Anthony Watts, who runs a climate science denial blog, wrote an email to one of the authors of the NOAA paper, telling him,
In fact, accusing the NOAA scientists of fraudulently ‘manipulating data’ for the benefit of the Obama administration was a common theme in the climate science-denying blogosphere. But there’s a glaring flaw in this particular conspiracy theory.
4. The Adjustments Reduce Global Warming Estimates!
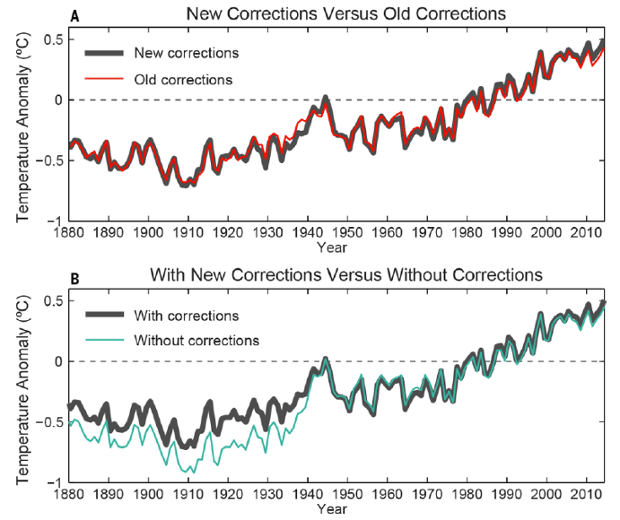
This is clear from the bottom frame in this figure in the NOAA paper.

According to the raw, unadjusted data, global surface temperatures warmed about 0.9°C from 1880 to 2014. According to the new NOAA analysis, they warmed about 0.8°C during that time. That’s a bit more than in the previous version of NOAA’s data set (0.75°C), but the net effect of these adjustments is toreduce the overall estimated warming as compared to the raw data!
5. The Adjustments are Important
Contrary to the conspiracy theories, climate scientists process the raw temperature data for an important reason – to remove biases that don’t represent real temperature changes. The big one in the new NOAA analysis deals with changes in the ways ocean temperatures have been measured. They’ve been measured from water samples in insulated buckets, uninsulated buckets, from valves in ships’ hulls, and from instruments on buoys. As Zeke Hausfather explains,
While this adjustment happens to have reduced estimates of the 1998–2012 surface warming slowdown, it’s important to account for changes in the way ocean temperatures have been measured. It’s not a conspiracy, it’s science.
6. The Slowdown and Anti-Policy Arguments are Fragile
The latest changes to the NOAA data set were quite small (compare the black and red lines in the top frame of the figure above). As NASA GISS director Gavin Schmidt noted at RealClimate, if such minor changes are all it takes to make the so-called ‘hiatus’ go away, then it was really quite fragile to begin with. As were any hiatus-based anti-policy arguments.
The bottom line is that the Earth continues to warm dangerously rapidly, and short-term wiggles in global surface temperatures are no reason for complacency. When those who believe otherwise are forced to resort to baseless accusations of fraud and conspiracy theories, it’s time to stop listening to them.
Comments